
Quick Answer
The return on investment (ROI) of a DC fast charging station is determined by four variables — utilization rate, revenue per session, conversion efficiency, and lifetime operating costs — not by the sticker price of the hardware. A high-ROI station in 2026 combines ≥97% SiC-based conversion efficiency, a modular power-sharing architecture that keeps utilization high across heterogeneous vehicles, liquid-cooled cables for 800V fleets, OCPP 2.0.1 compliance for smart energy management, and a service model that minimizes downtime. Industry benchmarks show well-sited commercial DC stations at 15–25% average utilization achieve payback in 3–6 years, while the same hardware at 5–8% utilization may never break even. This guide walks through the ROI equation, the efficiency math, the hidden OPEX traps, and a step-by-step selection framework so buyers can evaluate total cost of ownership (TCO) over a 10-year asset life instead of comparing price per kilowatt.
Key Takeaways
- Utilization is the dominant ROI variable: payback swings from under 3 years at 25% utilization to 12+ years (or never) below 8%, so site selection and power architecture matter more than hardware price.
- Conversion efficiency is a P&L line item: every 1% of efficiency is worth roughly €800–1,200 per 200,000 kWh of annual throughput over 10 years; SiC-based chargers at 97%+ efficiency outperform IGBT units at 94–95% on lifetime energy cost alone.
- Modular power-sharing architecture raises utilization by dispatching power dynamically between vehicles, reducing the number of “idle but installed” kilowatts.
- Hidden OPEX dominates TCO: downtime, maintenance contracts, payment processing, software fees, and grid demand charges typically exceed the hardware price difference between competing vendors.
- Future-proofing is cheap at purchase time and expensive later: 800V compatibility, liquid cooling, ISO 15118-20, and V2G-ready modules should be specified now, because retrofitting usually means replacing power stages.
The ROI Equation: What Actually Determines Payback
Every DC fast charger purchase is, in effect, a revenue infrastructure investment, and the asset’s return follows a simple identity:
Net annual cash flow = (Utilization × Sessions per day × Revenue per session) − (Energy losses + O&M + Software + Payment fees + Grid demand charges)
Payback period = Installed CAPEX ÷ Net annual cash flow.
Most failed charging investments trace back to one mistake: optimizing the CAPEX side of the equation while ignoring the revenue and operating sides. A $20,000 “cheap” charger that idles at 5% utilization and requires quarterly service visits produces negative returns, while a $60,000 charger at 25% utilization in the right location can pay for itself in under three years. The 2026 selection process should therefore start with a utilization forecast grounded in real traffic data — nearby EV population, competitor station throughput, dwell-time patterns — and only then map hardware specifications to that forecast.
Three financial terms define the decision framework. CAPEX includes hardware, grid connection, civil works, permits, and installation — typically 60–75% of a station’s first-year cost. OPEX includes energy purchase, conversion losses, maintenance, software/platform fees, payment processing (2–4% of transaction value), network connectivity, and insurance; over 10 years, OPEX on a busy station routinely exceeds the original CAPEX. TCO is the sum of CAPEX and discounted OPEX minus residual value — and it is the only number that should appear on the vendor comparison spreadsheet.
Conversion Efficiency Is a P&L Line Item, Not a Spec Sheet Detail
Conversion efficiency is the most underweighted specification in DC charger procurement, and it is the one where SiC-based hardware creates a structural advantage. Efficiency determines how much of the electricity a site buys actually reaches vehicle batteries. A 97% efficient charger wastes 3% as heat; a 94% efficient charger wastes 6% — and that wasted energy is purchased at the site’s commercial tariff, then dissipated, on every single session for the life of the asset.
The arithmetic is decisive at scale. Consider a 120 kW station processing 200,000 kWh per year (roughly 13–14 full sessions per day). A 3-percentage-point efficiency gap between an IGBT unit (94%) and a SiC unit (97%) wastes an extra 6,000 kWh per year. At a blended commercial electricity cost of €0.20/kWh, that is €1,200 per year — €12,000 over a 10-year asset life, per charger. A four-charger site is losing €48,000 of pure margin to an inferior power stage. This is why MIDA Power builds its DC fast charging stations around SiC charging modules that sustain 97%+ conversion efficiency across the load range, not just at a single peak-point.
Efficiency also compounds thermally. Lower losses mean less waste heat, smaller cooling loads, higher power density in the same footprint, and longer lifetimes for capacitors, fans, and power semiconductors — the components most likely to fail in early-generation chargers. In hot climates or enclosed sites, a 3% efficiency advantage can reduce cooling energy by 20–30% and materially extend module life, which flows directly into lower maintenance OPEX.
How Efficiency Compounds Over a 10-Year Asset Life (per 120 kW charger, 200,000 kWh/yr throughput)
| Efficiency | Annual energy loss | Extra cost vs. 97% unit (€0.20/kWh) | 10-year cost vs. 97% unit |
|---|---|---|---|
| 94% (typical IGBT) | 12,000 kWh | €1,200/yr | €12,000 |
| 95% (mid-tier IGBT) | 10,000 kWh | €800/yr | €8,000 |
| 96% (optimized IGBT/SiC hybrid) | 8,000 kWh | €400/yr | €4,000 |
| 97%+ (SiC, MIDA-class) | ≤6,000 kWh | Baseline | Baseline |
Utilization Is King: Matching Power Architecture to Demand
A charging station earns money only when a vehicle is plugged in, and the single largest driver of that earning rate is average utilization — the share of the day a charger actually delivers power. Industry data consistently shows that stations below roughly 8% utilization (about 2 sessions per day at 40 kWh) rarely recover CAPEX, while stations above 20% utilization approach 3-year paybacks. The hardware choice influences utilization through three levers: power rating matched to dwell time, power-sharing architecture, and connector/cable configuration.
Power rating vs. dwell time. A highway station serving drivers who stay 20–30 minutes needs 150–350 kW to complete meaningful sessions; a fleet depot with 6–8 hour dwell windows can be optimally served by 60–120 kW units at a fraction of the CAPEX. Oversizing power for the dwell profile inflates CAPEX without adding revenue; undersizing it caps revenue per parking space. Matching the power class to the observed dwell-time distribution is the first utilization lever.
Power-sharing architecture. A 240 kW power-sharing station with four dispensers can charge one 240 kW-capable vehicle at full power, two vehicles at 120 kW each, or four vehicles at 60 kW each, dynamically reassigning power as sessions complete. Versus four fixed 60 kW units, power sharing delivers comparable average throughput with one-third less grid capacity and roughly 25–40% lower hardware CAPEX — and it keeps utilization high during mixed-traffic periods when a fixed-power layout would leave kilowatts idle. MIDA’s 120kW–240kW DC fast EV charger stations implement this dynamic allocation natively, which is why they are specified for both urban corridors and depot applications.
800V compatibility and liquid cooling. The 2026 passenger EV fleet is rapidly migrating to 800V architectures (the Hyundai E-GMP family, Porsche, Lucid, and most new Chinese platforms), and heavy-duty electric trucks are arriving with 800–1000V packs. A charger that tops out at 500V cannot fast-charge these vehicles at rated speed, which silently caps utilization as the fleet mix shifts. Liquid-cooled cables — standard on 600kW–720kW liquid-cooled DC charging stations and increasingly available on 120–240 kW units — sustain 600A+ continuous output without cable overheating or driver-handling weight penalties. Specifying 800V-ready output and liquid-cooled cabling now protects utilization against the 2026–2028 vehicle mix.
2026 DC Fast Charger Configuration Comparison
| Configuration | Typical output | Best-fit use case | Relative installed CAPEX | Efficiency | Typical utilization | Indicative payback |
|---|---|---|---|---|---|---|
| 60 kW dual-gun | 60 kW shared | Small fleet, workplace, retail | $ (lowest) | 96–97% | 10–15% | 5–8 years |
| 120 kW dual-gun | 120 kW shared | Urban corridor, taxi/ride-hail hubs | $$ | 97%+ | 15–22% | 3–6 years |
| 240 kW power-sharing (4 dispensers) | 240 kW dynamic | Highway, mixed-traffic sites | $$$ | 97%+ | 18–25% | 3–5 years |
| 600–720 kW liquid-cooled | 600–720 kW dynamic | Truck corridors, bus depots, flagship HPC | $$$$ | 97%+ (liquid-cooled) | 15–25% (HDV fleets) | 4–7 years |
The Hidden OPEX: Downtime, Maintenance, and Software Costs
Hardware price differences between vendors are usually a one-time, 5–15% swing in first-year cost; operational differences compound for a decade. Four OPEX categories deserve the same scrutiny as the spec sheet.
Downtime is revenue destruction. A station with 98% availability over a year is down roughly 7 days; at 95% availability it is down 18 days. On a station earning $150/day of gross margin, that availability gap is worth $1,650/year in lost revenue — and worse, every downtime event sends drivers to the competitor next door and erodes network brand. Buyers should demand documented availability figures, remote diagnostics, and field-service response SLAs (24–48 hours in the region of installation), and prefer architectures with hot-swappable power modules so a failed module is replaced in under an hour without station shutdown. Modularity is the single most effective downtime countermeasure.
Maintenance contracts and consumables. Liquid-cooled systems carry coolant-maintenance requirements; air-cooled systems carry filter-cleaning cycles; both carry contactor, connector, and cable wear. Vendors that publish maintenance intervals and genuine part costs enable honest 10-year OPEX forecasting. Beware of “free first-year service” offers that convert into captive, above-market contracts in year two — ask for the year-2/3 service price in writing before purchase.
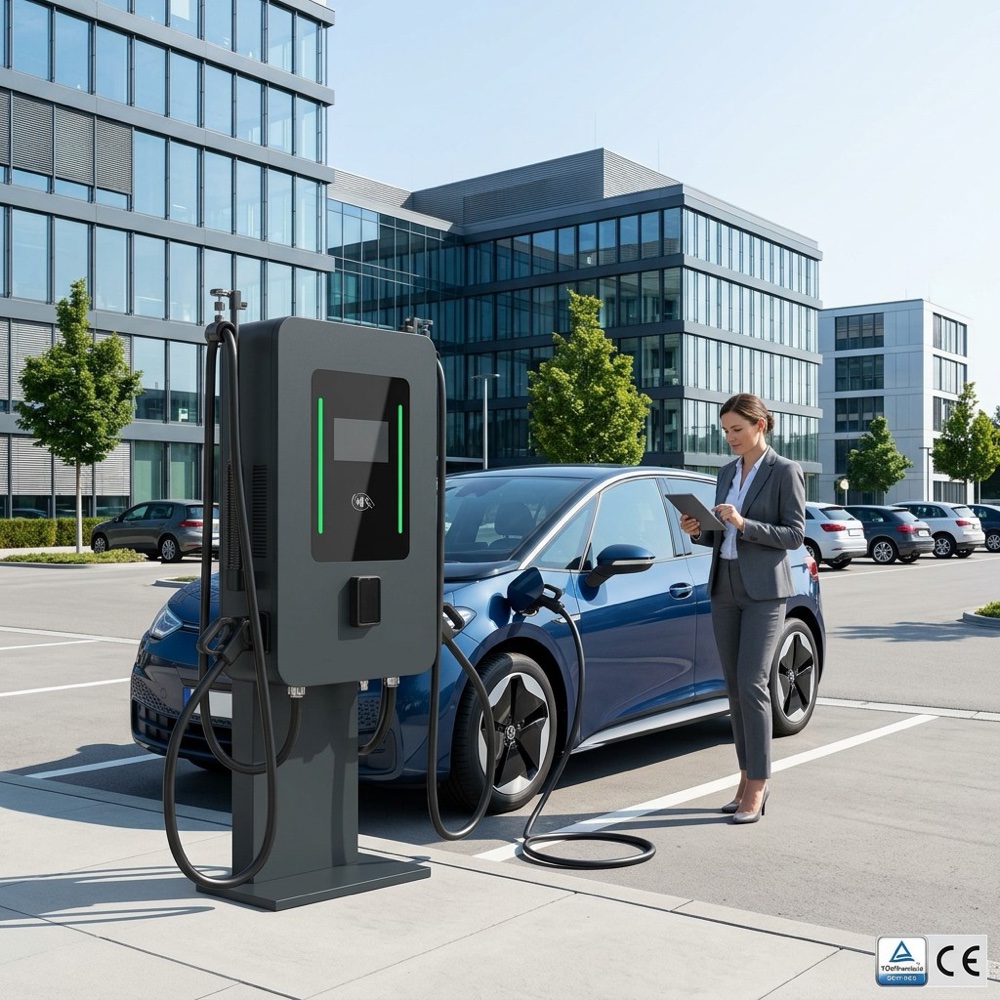
Software and platform fees. Network-management platforms (OCPP-based) typically charge €50–150 per charger per month; payment processing adds 2–4% of transaction value; some “free” vendor platforms monetize the site’s energy data or lock the operator into proprietary roaming. OCPP 1.6J/2.0.1 compliance preserves the operator’s right to switch platforms and negotiate fees — a contractual detail worth more than most hardware discounts.
Grid demand charges and energy procurement. In markets with kW-based demand tariffs, a fast charger’s peak draw can dominate monthly bills. Dynamic load management, on-site storage, and time-shifted charging via smart charging can cut demand charges by 20–50%. This is where a station’s V2G-readiness pays even before V2G launches: a V2X-ready 120kW DC fast charger can later shave site peaks using connected vehicle batteries, converting a cost center into a savings instrument.
Compliance, Certifications, and Grid Integration
Certifications are not paperwork — they are the gatekeepers of revenue and liability. Every station must satisfy the electrical safety standards of its target market: CE marking and IEC 61851-23-1 in Europe, UL 2594/UL 2202 and FCC in North America, and increasingly TÜV-type third-party testing for bank financing and utility interconnection. Buyers should verify that the certification documentation matches the exact model and software version delivered, because some vendors certify a reference unit and ship lower-spec variants.
Metering accuracy is a second, frequently missed compliance issue. Commercial billing requires MID-certified (EU) or NTEP/Weights-and-Measures-approved (US) energy meters; a charger without certified metering cannot legally bill by the kilowatt-hour in many jurisdictions and is relegated to per-minute pricing with lower margins. Third, grid-connection compliance — including power quality (EN 50160), harmonic limits, and islanding protection — determines how fast the utility approves interconnection and whether penalty charges apply. Finally, accessibility regulations (ADA in the US, AFIR accessibility provisions in the EU) govern layout, cable reach, and payment interfaces; failing them exposes operators to fines and restricts eligible sites.
Future-Proofing for 2026 and Beyond: 800V, V2G, and Storage
Charging infrastructure is a 10-year asset in a 3-year technology cycle, which makes future-proofing a core ROI decision. Four capabilities purchased today avoid expensive replacement tomorrow:
- 800V/1000V DC output — required to charge the 2026–2028 EV and e-truck fleet at rated speed; without it, utilization decays as the fleet mix evolves.
- ISO 15118-20 bidirectional readiness — enables Plug & Charge and future V2G revenue without power-stage replacement.
- OCPP 2.0.1 smart charging — unlocks dynamic load management, tariff-based scheduling, and participation in demand-response programs.
- Energy-storage and solar integration — a charger with DC-coupling or AC-coupling interfaces can pair with batteries and PV to cut demand charges, arbitrage prices, and charge during grid outages; sites that defer this option should at minimum reserve the interconnection capacity and physical space.
The cost of these capabilities at purchase time is typically 5–15% of hardware value; the cost of retrofitting them later is frequently a full power-stage replacement. For buyers financing through banks or leasing, a V2G-ready, 800V-capable station also holds higher residual value and qualifies for more favorable green-finance terms in several markets.
A Step-by-Step Selection Framework
Step 1 — Model the site, not the hardware. Estimate daily sessions from local EV counts, competitor throughput, and dwell-time patterns. Compute required kWh/day and the utilization range. If forecast utilization is below 8–10%, fix the site (or the power architecture) before buying hardware.
Step 2 — Set the power architecture. Match power class to dwell time; prefer power-sharing multi-dispenser configurations over fixed single-output units; add liquid cooling where sustained 600A+ output or HDV traffic is expected.
Step 3 — Rank vendors on TCO, not price. Build a 10-year model: CAPEX (hardware, grid, civils), energy losses by efficiency class, maintenance and SLA costs, software fees, payment fees, and downtime losses. A vendor 10% more expensive on hardware but 2 points more efficient with a stronger service network usually wins the TCO comparison.
Step 4 — Verify certifications and interoperability. Confirm CE/UL/TÜV documents match the delivered model, MID/NTEP metering, OCPP compliance, and ISO 15118-20 readiness. Request the OEM vehicle compatibility list.
Step 5 — Contract for availability. Demand documented uptime figures, 24–48h regional service SLAs, hot-swappable modules, published spare-parts pricing, and a 3-year (or longer) warranty on power modules and converter stages.
Step 6 — Design for the future. Specify 800V output, V2G-ready modules, smart-charging protocols, and reserved capacity for storage/solar, so the 2026 station remains a revenue asset through 2035.
Indicative ROI Sensitivity: 120 kW Station, $60,000 Installed CAPEX
| Scenario | Sessions/day (avg 40 kWh) | Utilization | Gross margin/yr | Net cash flow/yr* | Payback |
|---|---|---|---|---|---|
| Weak site | 2 | ~3% | $11,680 | ~$4,000 | 15+ years (marginal) |
| Average site | 6 | ~8% | $35,040 | ~$16,000 | ~4–5 years |
| Strong site | 12 | ~17% | $70,080 | ~$38,000 | ~2–3 years |
| High-traffic corridor | 20 | ~28% | $116,800 | ~$68,000 | ~1.5–2 years |
*Net of energy losses (97% efficiency), O&M, software, and payment fees; gross margin assumed $0.40/kWh retail minus $0.20/kWh energy cost. Figures are illustrative planning estimates for 2026 market conditions, not guarantees.
FAQ
1. What is a good payback period for a DC fast charging station?
For commercial sites, 3–6 years at 15–25% average utilization is the 2026 benchmark; high-traffic highway locations can reach 2–3 years. Below roughly 8% utilization, payback stretches beyond 10 years, which usually means the site or the power architecture is wrong.
2. How much does a DC fast charging station cost in 2026?
Installed CAPEX including grid connection and civil works typically ranges from $20,000–$45,000 for a 60 kW unit, $45,000–$90,000 for 120–240 kW stations, and $150,000+ for 600 kW+ liquid-cooled systems. Hardware alone is usually 40–60% of that total.
3. What conversion efficiency should I look for in a DC charger?
At least 96% peak, and ideally 97%+ sustained across the load range — the signature of SiC-based power stages. Every percentage point of efficiency is worth roughly €800–1,200 per 200,000 kWh of annual throughput over a 10-year asset life.
4. Are liquid-cooled chargers worth the extra cost?
Yes when sustained high current matters: 800V passenger EVs, electric trucks and buses, and sites with high session density. Liquid-cooled cables maintain 600A+ output continuously and handle lighter than air-cooled cables. For low-power or low-density sites, air-cooled remains cost-effective.
5. How many charging sessions per day do I need to break even?
With a typical 120 kW station and $60,000 installed CAPEX, roughly 5–7 sessions per day at 40 kWh each yields a 4–5 year payback. Below 3 sessions per day, the business case is marginal regardless of hardware price.
6. What certifications must a DC charger have for commercial deployment?
CE marking and IEC 61851-23-1 in Europe; UL 2594/UL 2202 and FCC in North America; MID-certified (EU) or NTEP-approved (US) metering for kWh billing; plus local grid-connection compliance (EN 50160, IEEE 1547). Verify certificates match the delivered model and software version.
7. Should I buy a V2G-capable charger now even if I do not plan to use V2G immediately?
Yes. The bidirectional hardware premium is only 5–15%, while retrofitting unidirectional power stages later usually means full replacement. V2G-ready, ISO 15118-20-compliant stations preserve the option for grid-service revenue, peak shaving, and backup power — and hold higher residual value.
Post time: Aug-18-2026